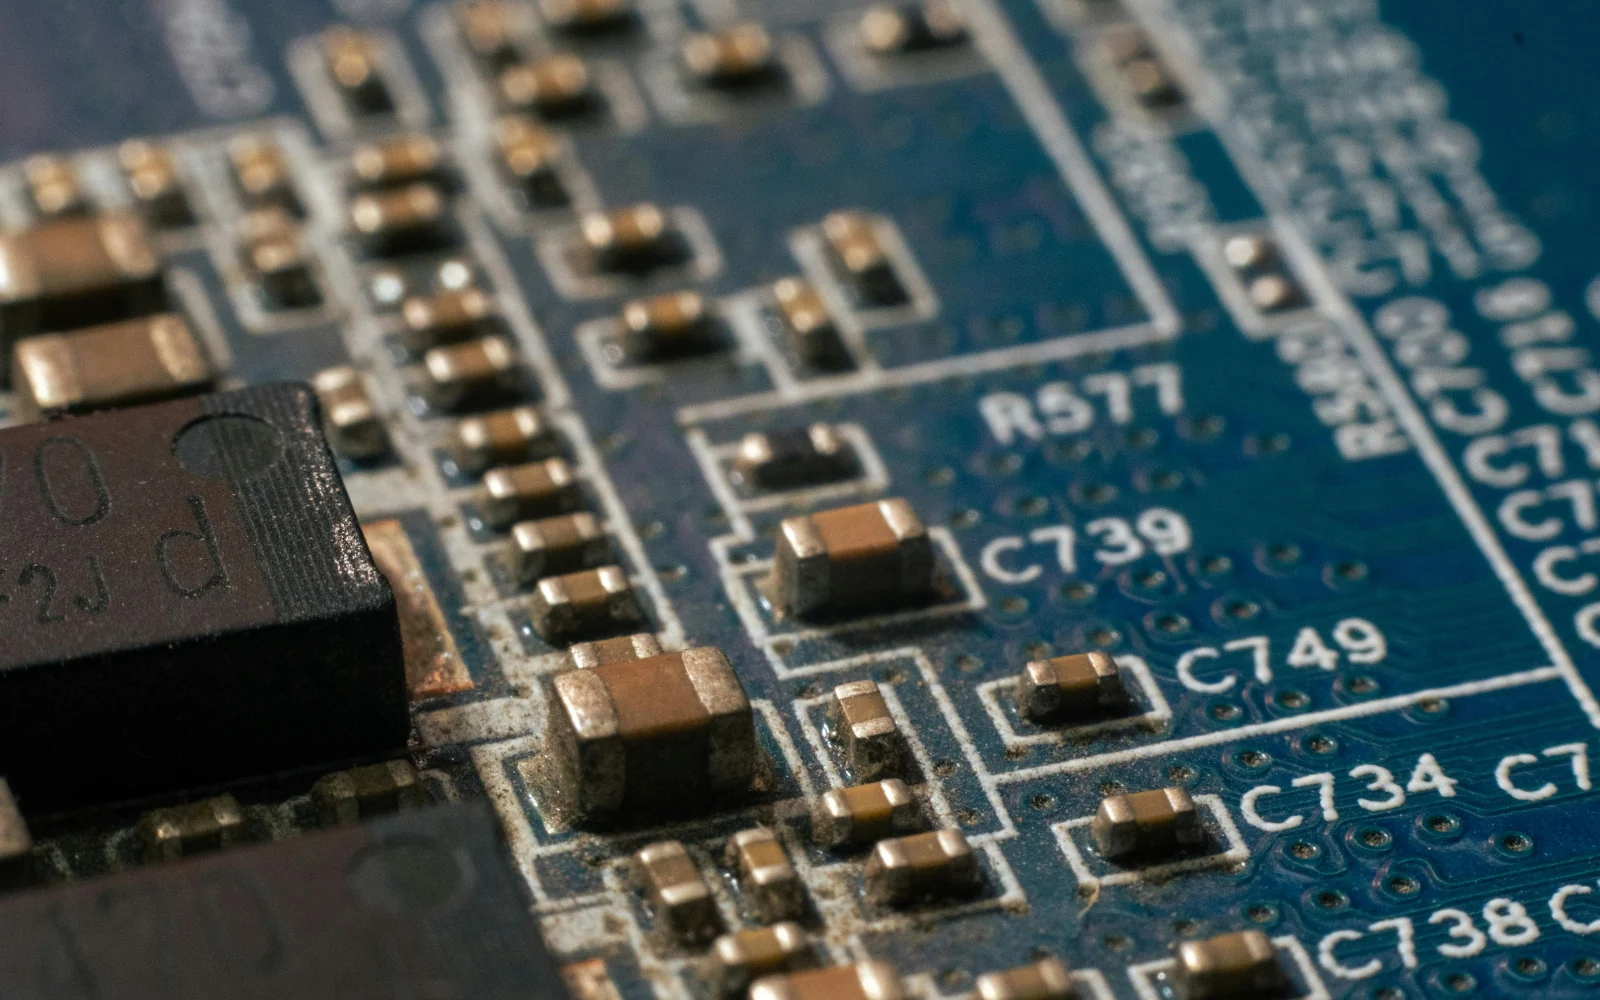
Illustrative engineering study
Building an end-to-end latency budget for edge AI
An illustrative vision-system study that measures capture, preprocessing, inference and application response together.
Embedded AI · 5 min read
Illustrative study: a hypothetical engineering scenario, not a completed client project. No client results or measured outcomes are claimed.
The application question
A hypothetical edge-vision device must react to incoming images within a defined time budget. A model benchmark looks promising, but the product also has to capture frames, move data, preprocess inputs and act on the result. The study asks how to compare implementation options using the complete application path.
No achieved accuracy, latency or energy figure is reported. This is an illustrative experiment plan. The workload, target processor, accelerator, model and operating conditions would need to be specified before any performance claim could be meaningful. A desktop demonstration is not evidence of behaviour on the intended embedded device.
Define the observation points
Start the latency clock at an event that corresponds to the product requirement, such as exposure completion or frame availability. End it when the application has produced the required response. Explain whether sensor exposure and actuator delay are included. Otherwise two teams can report different numbers while both believe they measured end-to-end latency.
Break the path into capture, transfer, preprocessing, inference, postprocessing and response. Identify queues and asynchronous boundaries. Timestamping should account for clock relationships and measurement overhead. Report distributions and relevant worst observed cases under the stated test, not only an average that hides occasional long delays.
Use representative data
A model’s behaviour depends on the data and conditions it encounters. Define a held-out evaluation set that reflects the intended use, including difficult lighting, motion, occlusion or background conditions where relevant. Keep training and evaluation data separate and document labeling assumptions.
Choose application metrics before optimizing the implementation. A classification score, detection threshold and false-positive cost answer different questions. If the product has a safety or security consequence, its assurance requirements need specialist review. A small demonstration dataset should not be presented as evidence of broad reliability.
Compare deployment choices fairly
Quantization, input resolution and operator selection can change memory use and execution time, but they may also alter model quality or hardware compatibility. Compare candidates on the same target and workload. Record unsupported operations and any fallbacks to a general-purpose processor because these can dominate a supposedly accelerated path.
Measure memory peaks, data movement and contention alongside inference time. Repeated copies between camera, processor and accelerator can erase the benefit of a faster kernel. Include concurrent product tasks in the test, and inspect whether queues grow when input arrives faster than the pipeline can process it. Decide explicitly whether to drop, replace or backpressure frames.
Challenge sustained operation
A short benchmark may miss thermal throttling, resource leaks or intermittent contention. Run the workload for a duration appropriate to the experiment and record environmental and power conditions. Observe startup separately from steady state. The first inference can include initialization or allocation that later iterations do not.
Test what happens when the sensor fails, the model cannot load or inference exceeds its deadline. The product needs a defined fallback or error state, not only a successful prediction path. Keep these recovery behaviours in the same acceptance discussion as performance because users experience the complete system.
A practical profiling worksheet
Create one row for each stage of the application pipeline and record its input, output, execution resource and timestamp source. Mark copies, queues and synchronization points explicitly. A stage that appears fast in isolation may spend substantial time waiting for a buffer or a shared accelerator in the complete application. The worksheet should make those waits visible.
Compare a steady stream with a burst of frames and a concurrent application task. Record whether the device drops old frames, queues them or rejects new work. A product may prefer a recent result to a complete but stale sequence, but that is an application decision. Define the policy before interpreting the latency distribution so that an apparent improvement is not simply the result of silently discarding more work.
For each candidate model, retain the evaluation-set identifier and the exact preprocessing configuration. A resize, color conversion or normalization change can alter quality independently of the model weights. Run the quality evaluation through the deployed preprocessing path where practical. Review results with the application owner, who can explain the consequence of false positives, missed events and late responses. This connects optimization to the product decision rather than to an isolated benchmark score.
Present the decision with limits
The illustrative deliverable is a comparison matrix with model revision, input configuration, target build, measurement procedure and observed results. State the evaluation-set boundaries and the unresolved product questions. A preferred candidate should be selected against the agreed quality, latency, memory and operational requirements.
This approach helps a team decide what to implement next without converting a benchmark into a marketing claim. A real project would still need its own integration, reliability and deployment validation. The example provides a workflow for collecting that evidence and making the tradeoffs visible.
THE WORKFLOW
From the first question to a usable handoff.
- 01
Define the application metric
Choose the start and end events, required response and representative operating conditions.
- 02
Profile the full pipeline
Measure capture, copies, preprocessing, inference and postprocessing with traceable timestamps.
- 03
Compare target candidates
Evaluate quality, latency distributions, memory and sustained operation on the actual deployment platform.
- 04
Review fallback and release
Document timeout, sensor failure and recovery behaviour alongside the selected model and runtime configuration.
What to bring. What to review.
Starting inputs
- Application response requirement and target hardware
- Representative evaluation data and model revision
- Runtime, sensor and accelerator configuration
Proposed review package
- Pipeline timing and resource profile
- Quality/performance comparison matrix
- Deployment assumptions and failure-handling plan
Questions before you begin.
Is inference time the same as application latency?
No. The product also spends time capturing, transferring and processing data before and after model execution. The measurement boundary must match the requirement.
Will quantization always improve the product?
No. It can change accuracy, operator support and memory behaviour. Measure the candidate on the intended hardware and representative data.
Does the photograph show an Avecas deployment?
No. It is representative stock photography. This article is an illustrative study and does not identify a customer installation.
APPLY THE THINKING
Bring your actual design question.
Share your current inputs, interfaces and the decision you need to make. We can use them to define a focused engineering scope and its review evidence.